|

| Gary Novak
The Cause of Ice Ages and Present Climate |
The Future, as an Ice Age Begins
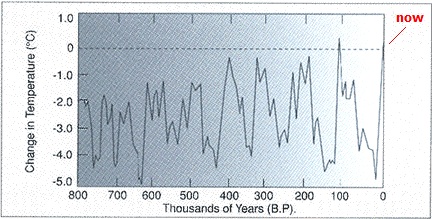
Ice ages have been occurring at 100 thousand year intervals. The next one is scheduled to begin at any time. There has to be more moisture in the air to start an ice age; so it appears that the next one will start in about 200-400 years. Over recent decades (1980-2005), winters were getting milder in North America due to ice melting around the North Pole. There was also an increase in rainfall due to warmer oceans evaporating more moisture. With growing seasons getting longer, the result was good for agriculture. The corn belt moved farther west into the plains producing record corn and soybean harvests. The cold of an ice age begins when snow and ice increase in northern areas reflecting away more radiation from the sun. Precipitation stays high, because oceans stay warm at the beginning of the reversal. The precipitation creates more snow when the reversal begins, and since more snow reflects away more sunlight, the cool-down is very rapid and irreversible. Sea level drops about 400 feet (130 meters) during an ice age. This is because moisture which evaporates from the oceans gets tied up over land as snow and ice. The ice accumulates for about 80 thousand years and then melts for about 20 thousand years. Scientists used to assume that ice ages were a natural result of ice accumulating and melting in a cyclic manner. I theorize that the cause is a hot spot rotating in the earth's center and heating the oceans. Rotations in the earth's molten center could cycle in a precise way. Since ice ages have been cycling at this interval for only one million years, a natural geological change is indicated. One of the changes which has been occurring is that continuous cool-down of the earth results in the outer mantle getting thicker and the earth's core differentiating from its cooler surroundings. This differentiation would promote convectional currents in the molten center of the earth. Most critics of the carbon dioxide hype believe that increased energy from the sun is the cause of global warming. They may be right. I think the increased heat in the oceans is coming both from the core of the earth as geothermal heat and secondarily from sun.
|
|||||||||||||
 | ||||||||||||||