|

| Gary Novak
|
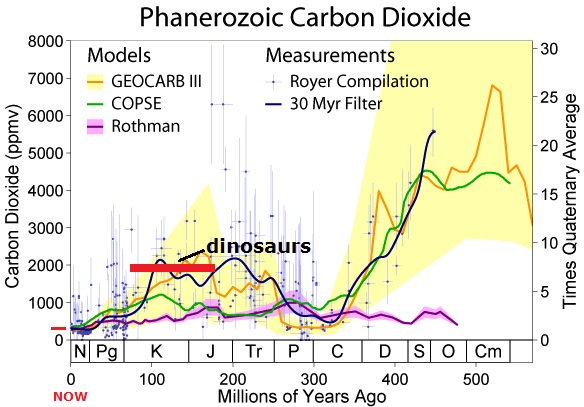
Graph of Phanerozoic Carbon Dioxide
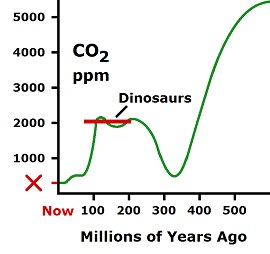
Source: http://en.wikipedia.org/wiki/File:Phanerozoic_Carbon_Dioxide.png Here is a redrawn graph for easier viewing:
There was five times as much CO2 in the air during dinosaur years, and twenty times as much when modern photosynthesis began. All biology is on the verge of becoming extinct due to a shortage of carbon dioxide in the air which is necessary for photosynthesis. The oceans constantly absorb CO2, as it combines with calcium to form calcium carbonate and limestone. The result was almost total depletion of CO2 from the atmosphere 325 million years ago (mya). Then a significant restoration of CO2 in the atmosphere occurred. Volcanoes would have been the source of the increase. More explanations are Here
|
|||||||
 | ||||||||