|

|
Gary Novak
The Cause of Ice Ages and Present Climate |
The Other Side of the Story by Alarmists This subject is described on the Real Climate web site—the usual reference for alarmists. Their conclusion is explained with this image: 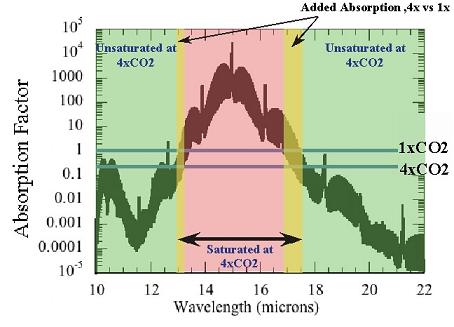
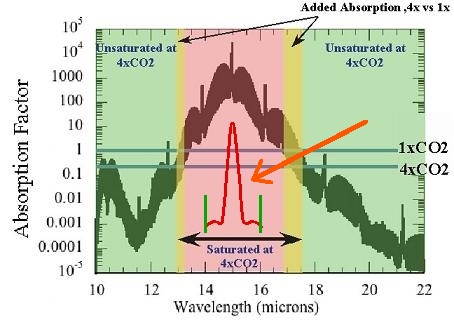
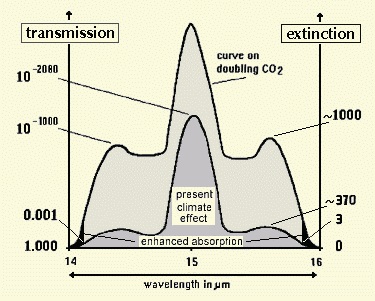
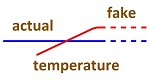
This thing is nothing but engine noise from a WW-II propeller aircraft. Electrical noise from the engine was picked up through the air by the electronic measuring instrument, which is a common problem that modern electronics copes with more effectively. The graph has no resemblance to the absorption spectrum for CO2. It's a sine wave. The CO2 absorption spectrum is a bell curve. The CO2 absorption curve can never be outside 14 to 16 microns, as shown by this graph which has the actual curve inserted in red showing the outer limits. This is the actual CO2 absorption curve as measured under laboratory conditions by Heinz Hug: The explanation with the engine noise graph is total fraud, because it says the bandwidth widens with increased CO2 in the atmosphere. It does not. Only energy state of the molecules determines bandwidth, and it does not change with more being added to the atmosphere. Heinz Hug measured absorption with doubling of CO2 and showed that the bandwidth does not increase. Notice that the slope of the absorption spectrum used by alarmists is about 45 degrees of angle. This leaves a lot of space for change. But the actual absorption spectrum for CO2 is nothing resembling this. The edges are sharp. The actual absorption spectrum for CO2 is bounded by the wavelengths 14 to 16 microns. In the above image, the relevant band is shown as 13 to 17.5 microns. CO2 cannot absorb at such wavelengths. The wavelength of absorption is determined by the energy state of the molecules, while increasing the amount of CO2 does not change the energy state. So where do these 45 degree angles come from? This graph is based upon measurements high in the atmosphere by the Air Force during WW-II. The atmosphere doesn't represent anything close to an absorption spectrum for a single gas such as CO2. After radiation goes through several kilometers of atmosphere it is influence by a large number of unknown factors including scattering and absorption by any number of unknown substances. This means that the angled slopes on the curve are not caused by CO2 but other things. So the entire rationale for absorption on the edges of the absorption spectrum is not valid. This graph is not a properly scaled representation of anything. It's designed to catch the eye of the unwary, much like the fake hockey stick graph. Oddly, they multiplied the CO2 level by a factor of four, where the usual question is what happens upon doubling of CO2. Then the lines across the graph for 1X and 4X have no meaning. They don't intersect with anything relevant on the graph. The 1X line is arbitrarily placed at one absorption unit, and the 4X line is placed at the 0.5 absorption units, while the peak is at 10,000 absorption units. So how do they know that the increase will widen the effective absorption by almost one micron of wavelength? There is nothing on the graph or anywhere in science which will tell them that.
|