1. A primary effect could not be determined. With the first attempt, modeling the atmosphere supposedly produced the number as 3.0°C upon doubling CO2 in the atmosphere (Charney et al, 1979, and Ramanathan et al, 1979). Modeling is not possible without starting with a primary effect to feed into the model as heat caused by CO2. Yet the primary effect was the end result rather than the starting point.
2. The second attempt to determine the primary effect used "empirical observation," which means assumed history of 0.6°C temperature increase with 100 parts per million CO2 increase (Hansen et al, 1984, 1988). But the history included secondary effects, while it was used to represent the primary effect. Now days, secondary effects are said to be three times as much as the primary effect.
3. The third attempt to determine the primary effect used "radiative transfer equations" combined with atmospheric modeling (Myhre et al, 1998). But there is no way to get heat out of either alone or combined. A complex analysis might have added heat, but it was not mentioned, and it would have conflicted with atmospheric modeling, which can only indicate total effects which do not separate primary from secondary effects.
4. Due to saturation, increasing CO2 in the atmosphere only shortens the distance radiation must travel to be completely absorbed. Changing the distance is not increasing the heat. Measurements show that CO2 absorbs all radiation available to it at the center of its main absorption peak in traveling ten meters near the surface of the earth.
5. Saturation near the surface could not be explained, as it would require 400°C temperature increase due to shoulder effects spread thinly through the atmosphere. Five percent of the CO2 on the shoulders of the absorption peaks would result in 1/20 of the heat producing 1/20 as much temperature increase for each unit of total heat, which means 400 times as much total heat for each unit of heat induced by humans.
6. An effect high in the atmosphere does not explain saturation, because it can't get high enough, and huge amounts of heat would be required for back radiation to increase near surface temperatures by the claimed 0.6°C.
7. Fakes claim carbon dioxide shifts the equilibrium temperature upward at the top of the atmosphere. There is no equilibrium temperature. Equilibrium involves every molecule and every temperature in the atmosphere and on the surface.
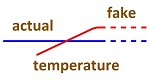
8. Land-based temperature measurements showed
no significant temperature increase, while the data was altered to show an increase.
9. The claim is often made or implied that nothing but greenhouse gases heat the atmosphere, and by the amount of 33°C. Yet scientists know that most heat enters the atmosphere through conduction and evaporation, not radiation, as shown in the NASA Energy Budget. Such contradictions go uncorrected.
10. There was five times as much CO2 in the air during dinosaur years as now, and twenty times as much before that, because oceans continuously absorb CO2 and tie it up as calcium carbonate and limestone.
11. All biology is on the verge of becoming extinct due to a shortage of carbon dioxide in the air which is necessary for photosynthesis. Tests say plants can photosynthesize down to 180 ppm CO2; but that is laboratory conditions. Stress will reduce species and create domino effects long before that, which is occurring to some extent now (due to 280-390 ppm recently). Optimum starts around 1,000 ppm and goes upward.
12. Acid in the oceans is totally contrived, as the ocean pH is strongly buffered at pH 8.1 by huge amounts of calcium carbonate. No one has ever found any other pH in the oceans beyond micro environments due to pollution or geothermal vents.
13. Sea creatures are totally immune to large scale pH changes, as hydrogen ion pumps are included with all respiration, and shells have complex structure including numerous minerals, proteins and carbohydrates for resisting environmental effects.
14. Natural effects including ice ages produce large variations in climate. The oceans drop 400 feet during an ice age and slowly increase between ice ages, which is occurring now. Ocean surface temperatures change drastically in short term cycles. Between 1980 and 1998, the surface of the Pacific Ocean was heating causing much rainfall in the U.S. and moderating temperature extremes. Now the surface of the Pacific Ocean is cooling resulting in severe droughts and cold winters.